News
Recognising thistles and treating them place-specific
How do you connect information in the arable data chain? The Connectivity component of the DISAC project has been working on this for the past three years. The focus was on place-specific treatment of thistles over several seasons by using the information collected in the chain over the years. The information gathered was then used to treat thistles within a multi-year crop plan.
IThistles are difficult to treat in onions, because onions are quite vulnerable to the products which are used to treat thistles. But it is possible to treat thistles in other crops, for example grains. The detection of thistles is assumed to be easier in onions compared to grains, since onions have a lot less dense biomass on the field. And since thistles are a root-weed they don’t tend to move much over the years. So objective in this project is to detect thistles in onions and treat them later on in other crops. In this project we will look at the ‘in between’ steps needed to achieve this.
Thistle recognition
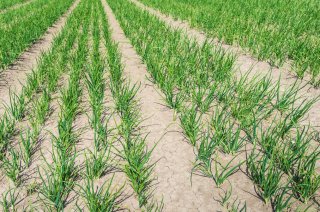
In 2018, 2019 and 2020 we have made drone images from different onion fields on different locations and in different growth stages, flown at different altitudes. In these images we annotated the thistles which were present, by going into the field physically and marking them with a GPS rover and also by manually annotate them from the drone images.
These images have been used to train a variety of neural networks. Despite the limited amount of data available for testing, and thus the significant possibilities for improving the models, we have found the following:
- At a flying altitude of 20 meters (pixels < 1 cm) we can find thistles, however, variation in your training data is key for performance.
- At a flying altitude of 50 meters (pixels +/- 1.5 cm) we can find a lot of thistles, but not the small ones. Thistle patches can be detected.
- A 100 meters flying altitude (pixels > 2 cm) is too much for thistle detection.
. Right below that, there is a false negative (a thistle that was not detected). At the bottom right of the image, there is a false positive (a weed detected as a thistle, which actually was not a thistle). Not marked in the image is a true negative in the upper right corner (a weed that wasn’t a thistle, which also wasn’t marked as a thistle). The blue points in the images are the top left corners of cut outs that were classified as having a thistle inside.")
Communication with a Kverneland Sprayer
The detected thistle spots were translated to an ISOXML task map. Around each thistle spot an extra zone is marked to compensate for the section widths of the sprayer and thus to make sure that all of the thistles are actually being treated. In the practical example we used for verification we found a saving on product of about 95 %. At the time, physical visits were restricted due to COVID-19, so verification was not done in practice, but on a test setup.

